Low-range turbidity monitoring should distinguish a change in filtrate from a change in the sample path or optical condition. The purchase needs an agreed measurement method, representative sampling and a practical way to investigate bubbles, deposits and instrument faults.
Describe the monitoring decision and measurement boundary
Identify whether turbidity is used to trend a filter, investigate an upset or support a defined water-release decision. These purposes require different response and evidence. State the expected range and the consequence of an adverse result without inventing a universal limit. Gather normal filtrate observations and information about upstream solids, colour and possible air entrainment. A low-range instrument should be selected for the water it will actually receive, including startup and cleaning transitions.
Keep turbidity distinct from suspended-solids concentration, particle counting and membrane integrity evidence. They describe related but different properties. A low turbidity value does not by itself demonstrate removal of every contaminant or establish RO feed suitability. Define which other measurements remain necessary at the receiving process. This makes the instrument's role clear and avoids treating a single optical signal as a substitute for the site's complete water-quality acceptance plan.
Compare optical methods before comparing numbers
Request the offered instrument's light source, detector geometry, reporting units and applicable method documentation. Different optical arrangements can respond differently to the same particle mixture. If the project needs comparison with an established laboratory instrument, identify its method before selecting the online unit. A common numerical range does not guarantee directly interchangeable readings. Agree how any method difference will be evaluated and documented in the procurement and commissioning records.
Use manufacturer manuals for the selected model rather than transferring settings from another instrument. Hach's TU5300/TU5400 manual includes signal averaging and bubble-rejection settings, illustrating that the displayed trend can be affected by configuration. This is background for asking about data handling, not a recommendation to copy a setting. Require the offered vendor to explain its own processing options and how they influence response to short genuine changes in the filtrate.
Send the feed-water analysis, target quality, required capacity and operating profile. We will help structure the next engineering questions.
Send your project inputsLocate a representative sample point
Choose a tap that reflects the stream whose condition matters. Avoid dead legs and locations where solids settle before reaching the analyzer. Document the pipe route, sample flow and transport volume. Changes to the sample line can change delay and particle behaviour even when the optical unit remains untouched. For a common header, determine whether the instrument observes combined filtrate or can distinguish an individual train that has deteriorated.
Compare minimum and maximum process pressure with the sample-system requirements. Include how sample flow remains stable as trains start and stop. Provide a method to recognize interrupted or stagnant flow as an invalid measurement state. Sample filters or conditioning devices that remove the particles of interest can defeat the purpose of monitoring. Any such component needs a documented analytical reason, with its effect on representativeness assessed before installation.
Investigate bubbles without hiding real events
Identify where pressure changes, pump suction conditions or upstream operations can introduce air into the sample. Observe how bubble events relate to the process and sample hydraulics. Ask the vendor for an approved approach to managing them. A bubble trap may improve some installations, but its volume and geometry can also affect response or allow solids to settle. Evaluate the complete arrangement rather than assuming that every additional sample-conditioning component improves measurement.
Discuss averaging and bubble-rejection functions with the process owner. Record the approved settings and evaluate whether a brief genuine breakthrough would still be visible. A smoother trend is not automatically a more faithful description of the water. Where alarms are used, define their delay in relation to measurement response and process risk. Keep raw or diagnostic information where the instrument supports it so operators can investigate repeated excursions instead of simply increasing the smoothing.
Plan cleaning and optical-condition checks
Determine how the measurement surfaces are inspected, cleaned and protected from damage. Include expected deposits from the actual water and approved cleaning agents. Ask whether automatic cleaning changes the validity of the reading during or immediately after its sequence. Provide adequate maintenance clearance and access to the measuring chamber. A package that requires dismantling nearby piping for routine optical work can lead to deferred maintenance and a misleading long-term baseline.
Request spare components, cleaning tools and consumables appropriate to the offered design. Establish a return-to-service check after optical work and a record of the instrument's condition before cleaning. This helps distinguish real changes in filtrate from drift associated with deposits. Where a scratch or damaged cell can affect low readings, define replacement criteria using the manufacturer's instructions. Avoid improvised polishing or cleaning methods that alter the optical surfaces without approved guidance.
Make online and laboratory comparisons defensible
Agree a paired-sampling procedure that accounts for transport delay, sample handling and particle settling. Collect near the analyzer under stable, documented conditions. Use appropriate clean containers and prompt measurement where required by the selected method. A sample carried through the plant and left standing may no longer represent the same particle condition as the online measurement. Investigate this before adjusting the analyzer merely to match an isolated laboratory result.
Separate calibration or standard checks from a complete test of the process sample path. A suitable standard can verify an instrument response without proving that water arriving at the chamber represents the process. Keep both forms of evidence. Where low-range disagreement persists, review optical method, bubbles, cleanliness and handling together. Record the conclusion and any limits on comparison so later staff do not repeat changes based only on a numerical difference without its context.
Define controls around validity and response
Specify high turbidity, lost sample flow, maintenance mode, instrument fault and lost communications as distinguishable states. Decide how each affects release or diversion under the site's approved water-quality plan. If a last valid result is retained for display, mark its age and validity clearly. A steady historical number should not continue to authorize current water indefinitely after the instrument has stopped obtaining representative measurements.
At acceptance, demonstrate changes in sample flow, communications and maintenance state along with approved measurement checks. Confirm the actual controller scaling, units, configured processing and alarm timing. Include the response after power restoration and after cleaning. If the instrument is used to investigate an individual filter, verify that the sample selection and identification are correct. Useful monitoring requires confidence in which water was measured as well as confidence in the optical response.
Prepare the turbidity-analyzer enquiry
Send Baihuipu the intended monitoring decision, expected range, optical method requirements, existing laboratory method and sample hydraulic data. Include process transients, potential air entry, cleaning conditions and maintenance access. Request a proposal covering the instrument and sample path together, with explicit configuration and validity states. Agree acceptance that checks representative sampling, analytical response and the control system's interpretation without claiming that turbidity alone proves every aspect of filtered-water quality.
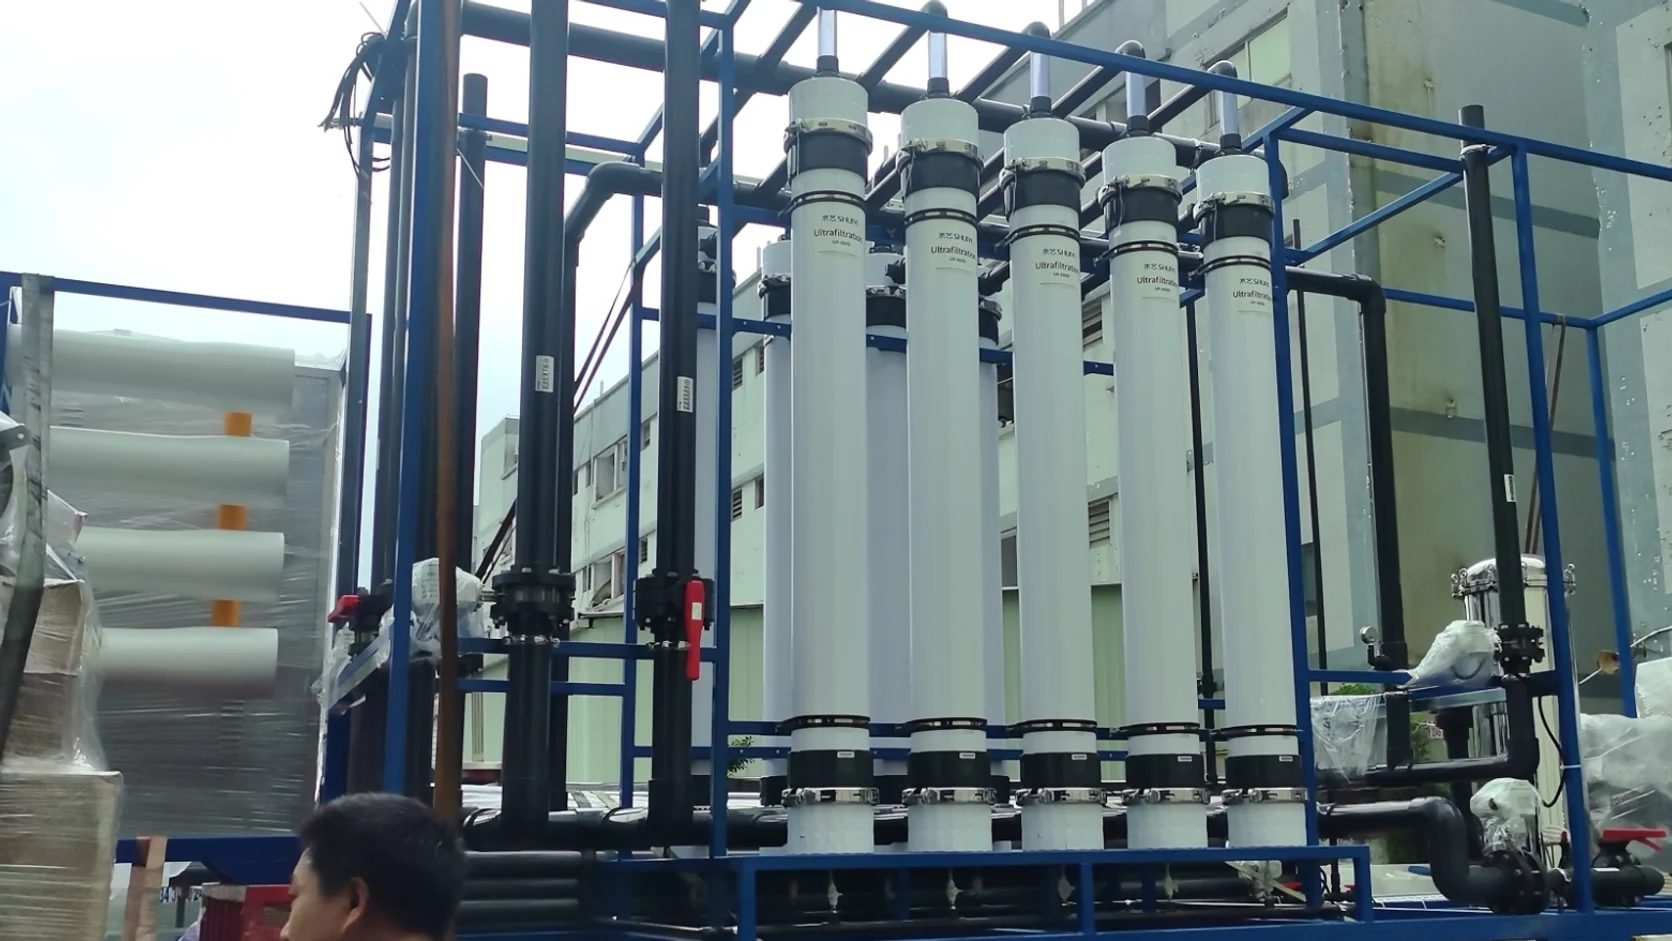
The featured image shows ultrafiltration modules and process piping as context, not a low-range turbidimeter or a barrier test. Use the offered model documentation and installed measurements for acceptance. The linked SDI and membrane-integrity guides describe separate evidence that may also matter to a treatment train. Keeping those methods distinct makes each result more useful and prevents a convenient optical trend from carrying an unsupported engineering conclusion.
Questions buyers commonly ask
Can turbidity readings be converted directly into suspended solids?+
Do not assume a universal conversion. Any site correlation needs appropriate data and remains dependent on the actual particle mixture and method.
Does a lower displayed fluctuation prove better water?+
No. Check processing settings, sample hydraulics, bubbles and optical condition before interpreting a smoother trend as process improvement.
Can laboratory and online instruments disagree while both function?+
Yes. Method differences, sample timing, settling and handling can affect comparison. Investigate the complete measurement conditions before changing calibration.
Is turbidity a replacement for UF integrity testing?+
No. Optical filtrate monitoring and a defined integrity test address different questions. Use each within its approved measurement and acceptance role.
Turn the guide into a project brief.
Final process selection and performance commitments should follow the complete feed-water analysis, application requirements, site utilities and approved technical agreement.